To call something a "current trend” means there have been other trends which implies either (1) that the referenced system has underground a permanent change of state or (2) the “trends” are natural system variance within a dominant lower frequency trend.
In any case – and despite the fact that it has no mathematical definition - the “current trend” of record-setting high temperatures – with all temperatures above the historic mean – suggests that there has either been a step-function phase shift or damping of a forcing variable - which, like a compressed spring is storing some of the input as potential energy.
Of course, both could be part of a single process where energy stored over time is released, causing the system to change states. What the “current trend” does not do is provide evidence of a change in the main forcing variable.
====
graphicconception ---
>> The same with "statistically significant". We have the English view and the statistician's view. It would be a great help if the non-statisticians took the time to find out what the statisticians actually mean by "statistically significant". It does not mean "significantly agreeing with your point of view". It has more to do with having enough data points to make a reliable statement.<<
Most excellent. Statistical significance (mathematicians adopted the term before it acquired its current language meaning) is a measure of confidence that the sample population accurately represents the true population, It is a function of sample size.
So, for example, if you have all of the information (every measurement for every variable from every member of the population) then every comparison will be statistically significant even if the difference is unimportant. Conversely, the punishment for too small of a sample is that important differences can test as not statistically significant - and vice-versa.
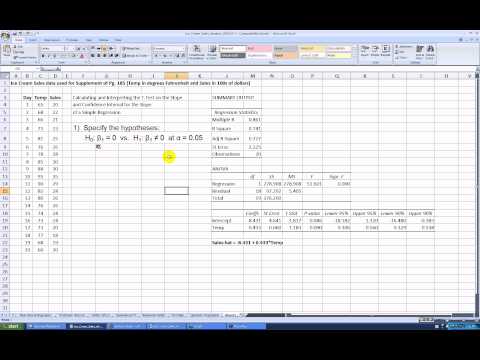
The two-sample t-test is the parametric test of choice for step-trends (because it compares the difference in sample means). When applied to time-series data, It works best if there is an actual gap between the two sample periods. The test is also sensitive to data that is skewed (not normally distributed).
0.093C +/- 0.101C. Do you think that is statistically significant?
Take it back to 1994. We get 0.112C +/- 0.094C. Do you think that is statistically significant?
What are the differences between the two?
Lets take it back to 1986. That is 30 years. We get 0.152C +/- 0.057C. Do you think that is statistically significant?
Edit: Why not? Do you understand what statistical significance means? Amazingly you were here during the 'Phil Jones statistical significance' phase of arguments yet you still do not understand what it means. Is this by choice?
Edit #2: Also, from your comment to virtualguy, you had already made up your mind what it means. Your first update was "Are you sticking to missing heat in the ocean for recent warming?". That right there tells me you haven't got a clue but you have already made up your mind and attempted to attack others concerning your 'missing heat'. Then your second question you don;t even admit your mistake you just say "Perhaps my wording was a bit loose".
Even though I am disposed to be anti-consensus, there are times when I feel the frustration of some of the experts here as well as the non-experts.
For instance, we have people who should know better endlessly quoting "97% of climate scientists". Opposing that we have people who take one view on a word (e.g. theory) and refuse to accept any others. There is an English meaning and a scientific meaning. Both sides would do well to see the problem from the other side.
The same with "statistically significant". We have the English view and the statistician's view. It would be a great help if the non-statisticians took the time to find out what the statisticians actually mean by "statistically significant". It does not mean "significantly agreeing with your point of view". It has more to do with having enough data points to make a reliable statement.
bubba touches on t-tests. Anyone not understanding t-tests and their relevance to trends could do worse than try to find some more videos like this one:
I think that it will show no significant change in temperatures from 1995 to the current year. You will have a very low number of observations. If you only loose 1 df (typical) your t-value (95% confidence - 2 tailed) for 17 df (2013-1995 = 18 - 1df for estimating = 17 df for the analysis). That makes your t-value 2.110 to determine you critical value for you upper and lower limits. You estimate would need to be higher than the upper-end critical value or lower than the lower-end critical value to be significant. That is why it is so hard to find trends with so few observations.
If you can go back 30 years, your t-value decreases to 2.042 and you standard error (hopefully) decreases. If your df exceeds 120, then your t-values is 1.96 and your standard error is more reflective of a longer period of time.
Be aware that if you are doing a time-series analysis using ordinary lest squares with annual observations, you standard errors could be biased unless you adjust for serial correlation. Usually, you standard errors will be overestimated so the critical vales that bound your upper and lower ends of your confidence intervals will be to high (or low). Auto regressive regression techniques may be more.
Also, remember that the analysis is really only reflective on the period you are looking at and you can't predict future changes (not far into the future - rule of thumb is 10% if series before you have to re-estimate everything). With 17 df, you can predict next year. With 30 df, you can predict next 3 years. With more than 120 observations you an try next 12 years. Can't go out far because of the way prediction intervals flare out as you get further into the future.
The temperature trend is insignificant at around 17-20 years, except for GISS. Even if it becomes 'significant', the peak to peak warming from 1998 will show a hundred year trend much lower than the predicted trends. Note, they always used to say that 1998 is a bad start year because it was the peak year. Well with another peak El Nino year, you are making a fair comparison and the conclusion is they are overstating the effects of global warming if they are claiming 3C, 4C, 5C or more.
What a lot of stupid quibbling, just a glance tells me temperatures have stop rising, they are high but they are not rising anymore, what happens next will be interesting they could start moving up again, there might be some delay factor (unlikely but possible) they could start falling or stay flat, but the signs are that climate sensitivity to CO2 has been exaggerated.
Only time will tell.
Come on Mike, you know it's warming. And you know why it's warming. CO2 is the problem. CO2 from burning fossil fuel.
It's not that I want it to be warming. Not that I like higher taxes. Or more expensive gasoline or electricity. None of us who are concerned about global warming want those things. We really are concerned about climate, at least in my case, long after I'll be dead. I'd like a better world for my children and grandchildren. I am aware that for many folks, higher gasoline prices will be a problem. Maybe you've noticed that I don't advocate for that any more. I used to, but having spent a small amount of time in poorer areas of the country, I don't do that any more. I am aware that it's going to have to happen, but it sure would be nice if other remedies could postpone that.
I try to be consistent in my arguments. Global warming is a serious problem that the US, and the world, need to address. Even China is moving in that direction. Clearly they have a population, and economic problem that they also need to address, but they are moving, much faster than the US, toward renewable energy.
And what do you have on the other side? "Warming stopped 17 years, 10 months ago." "Global warming is a plot to have the UN dictate policy to America." "More CO2 is better." Are those the people you want to align yourself with? I surely hope not.
I can say that your update shows you don't know or choose to ignore what "statistically significant" means.
Edit RE your WTF - from your update "So what comment do you have about this? " I answered that question.
I am going to use 1995 as a starting point since a lot of my background data is based on that. Let's start with Phil Jones comments in early 2010 about global temperatures:
"BBC: Do you agree that from 1995 to the present there has been no statistically-significant global warming
Phil Jones: Yes, but only just. I also calculated the trend for the period 1995 to 2009. This trend (0.12C per decade) is positive, but not significant at the 95% significance level. The positive trend is quite close to the significance level. Achieving statistical significance in scientific terms is much more likely for longer periods, and much less likely for shorter periods." http://news.bbc.co.uk/2/hi/8511670.stm
This caused such a stir that the climate spin doctors went into overdrive. But luckily, 2010 was a nice, warm year globally so in 2011, we a different tune:
""Basically what's changed is one more year [of data]. That period 1995-2009 was just 15 years - and because of the uncertainty in estimating trends over short periods, an extra year has made that trend significant at the 95% level..." http://www.bbc.com/news/science-environment-13719510
Phew, that was close, the warming was back. Well, here we are four years later, we are almost at the sacred 20 year mark from January , 1995 so let's take a look at the trend here: http://www.skepticalscience.com/trend.php