The data are available at...
http://www.psmsl.org/data/obtaining/map....
There are three tide gauges in the SF Bay. One at the Presidio, one at Alameda NAS, and one on the San Mateo Bridge. The third one is a short data set and not of much use.
The alarmists rely on the Presidio gauge, claiming a 6" rise in SL over the last century. The data shows that, but it also shows no acceleration post 1940; to the contrary, it suggests a deceleration. What rise is there is only significant you ignore geology. If the geologic movement is accounted for, the sea level trend at SFO is indistinguishable from zero.
Worse, some 13 km away, on the east side of the same bay, is the Alameda NAS gauge. The data there show no rise in 70 years. After correcting for the geological movement, there is a *downward* trend of about 0.8mm/yr on average.
Somehow all the alarmists manage not to notice that dataset.
None of this is what is predicted by the CAGW models. The validation is *zero*; the street-wise translation is "busted".
“It does not matter who you are, or how smart you are, or what title you have, or how many of you there are, and certainly not how many papers your side has published, if your prediction is wrong then your hypothesis is wrong. Period.”
―Richard Feynman
Contrary to popular belief, California will not fall in the ocean because it is an earthquake zone. In fact, earthquakes are what made the Rocky Mountains and the Alps. Uplift may be partially cancelling the effects of rising sea levels in the Bay area. In your link, I noticed a discontinuity in the data. It would have been very interesting if the discontinuity had happened in 1906, to correspond to the great earthquake. But the discontinuity happened about eight years too early.
None of this means that sea level rise will not accelerate.
stevegoddard has a graph of exactly what's going to happen real real real real real soon according to are warmunist buddies here high priest
Alarmists also warned of :
CA breaking off from continetal US,
Global colding in the 70s,
The human race completely dying out due to "Over population".
I seriously wouldn't trust anything these people say. Sure they might have a PHD and BS, but I think they're full of BS. and their Doomsday predictions are too.
It is scientific principle that mass is conserved and that increasing temperatures above 4°C will cause water to expand. In the past century the average temperature of the Earth has risen about 0.83°C, which is causing oceans to expand and contributing to the melting of land ice and glaciers. When the land ice and glaciers melt, the water runs into the ocean and causes them to rise. The data in the reference below shows the trend in the average sea level rise to be about 3.2 ± .4 mm per year over the last 30 years, which is an increase from the 2 mm per year you quoted for 1900.
Over the last century the sea levels rose an average of about 9 inches, which doesn't seem like much unless you consider what would happen if your seawall was 20 feet high in the storm surge was 20 feet and 9 inches high. Should people protected by seawalls be alarmed?
The ice sheets on Greenland are beginning to melt, and if that occurs the sea level will rise about 26feet, which will displace about one fourth of the US's population. When the ice sheets on Atlantica melts, the sea levels are predicted to rise over 100 feet, inundating most small islands and much of the area of continents where people live and food is grown. I see like to use the word "alarmist", but perhaps that is something we should be alarmed about as a long slow disaster is a disaster nonetheless.
The sea level rise is an average value and it has been observed that some areas are seeing more sea level rise than others. It's also interesting that you picked San Francisco, as the sea level seems to be rising at a slower rate there than on the east coast along North Carolina where it is rising about three times as fast as the average. That contributed to much the damage of the last two hurricanes that have hit the islands of North Carolina which are only a few feet above sea level. People that have homes on the barrier islands seem to be getting alarmed about that.
Caliserve seems to be a geologist and provided the geology so no need to repeat.
I officially excommunicate Gary Griggs as a geologist. He lends truth to the saying that those who can't educate. It irritates me when I read about a geologist who is an alarmist. He talks about a cliff erosion and purposefully mixes that with falling and rising coast line. He says, <<
Sometimes you end up getting deposition rather than erosion but it certainly isn't the rule in California. I would have expected a greater number than 950 miles. The difference between him and I is that I don't use meaningless numbers to try to scare people to push a political agenda. It is sad when an educator would rather lie than educate (giving him the benefit of the doubt that he really isn't that stupid).
The alarmist computers that run climate model software blew a fuse.
Worldwide Tide gauge data is available here.
http://www.psmsl.org/data/obtaining/
Here is the chart of the full record for San Francisco (1854 to 2011)
http://www.psmsl.org/data/obtaining/rlr....
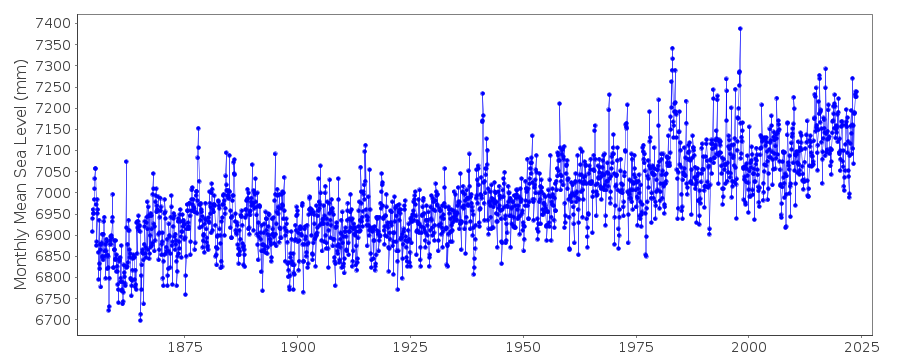
Here is the data.
http://www.psmsl.org/data/obtaining/rlr....
I don't see a downward trend at all... but presumably that depends on the time period you consider. The only big shift seems to be a dramatic rise 1860 to 1880, otherwise it looks like a fairly consistent slow rise hrough the whole 150+ year period of the record. What's interesting to note is that there is no apparent long term acceleration in the sea level rise.
I find it funny that you are calling out names once again. Why would you only choose one data point from the planet though? As has been stated numerous times here in the past, the science of climate change is not exact and there are a lot of variables. Especially for specific locations. and 20 years is a long time. The article you posted was posted in 2012. 20 years would be 2032. Did you come from the future?
But let us look at the possible reasons for the decrease in sea level since the 80s in this particular location.
http://link.springer.com/article/10.1007...
curious why you also do not take a longer time interval
http://tidesandcurrents.noaa.gov/sltrend...
edit: I stated and posted the last link because, as you stated in your own question, there are many ups and downs. You said that the sea level within this region had been declining since 1983. I reposted your graph showing you that there are many ups and downs in it, some which lasted for extended periods of time. However, as you are well aware and stated in your own question, this is too short a time interval to draw a meaningful conclusion giving that the noise in previous years has lasted for just such extended time periods. Just trying to drive the knowledge home my friend as you are already well aware of it.
No citizen in the world has ever noticed any rise in sea level whatsoever.
Scientists predicted that it would rise about 12 inches in 20 years.
http://www.insidebayarea.com/science/ci_20917927/california-faces-more-serious-risk-sea-level-rise?source=inthenews
I said that there was no way it would rise that much based off historical records (it's actually trending DOWNWARDS since 1983 but I don't want Jeff M of accusing me of cherry picking since I know you can't establish a trend with only 30 years of data.I think its 40 years, or 50 years if its still not trending your way, or maybe its 80 years. I can't remember if there is an exact amount of time because they seem to change their minds about it a lot) which shows it only rising at a rate of 2 mm/year since 1900.
http://spartandaily.com/wp-content/uploads/2012/12/12042012_JacquesInfoGraphic_JOrvis.jpg
I was told by Pegminer that you couldn't base prediction on past performance (I mean, it's ONLY a 30 year trend) and that I didn't understand science. Granted I don't understand how climatology is a real science (make a prediction, prediction fails to come true, adjust the data, make another prediction). Can one of the alarmists tell me approximately when the sea level in San Francisco will shoot up like a rocket? It's actually at a lower level than it was at the end of January last year. Is that supposed to be the way the trend is going? Will it shoot up all at once on the last day?