If 1979 is when we started estimating it with satellite data then so be it. If it was an unusually high extent that year then there is nothing we can do about that either. We have to measure it against something and I'd rather measure satellite data against satellite data.
Leave hiding the decline and switching out data sources to the alarmists. We have to be better than they are. Reality will win out in the end. It always does. That's why alarmists HATE reality.
Detection does not imply attribution, and is easier to show than attribution. Unequivocal attribution would require controlled experiments with multiple copies of the climate system, which is not possible. Therefore, attribution, as described above, can only be done within some margin of error. For example, the IPCC's Fourth Assessment Report says "it is extremely likely that human activities have exerted a substantial net warming influence on climate since 1750," where "extremely likely" indicates a probability greater than 95%.[1]
>>Until today I did not know that.<<
That is because you have never spent any time trying to learn anything about climate science or AGW. How do you expect to learn anything when you only read politically biased sources?
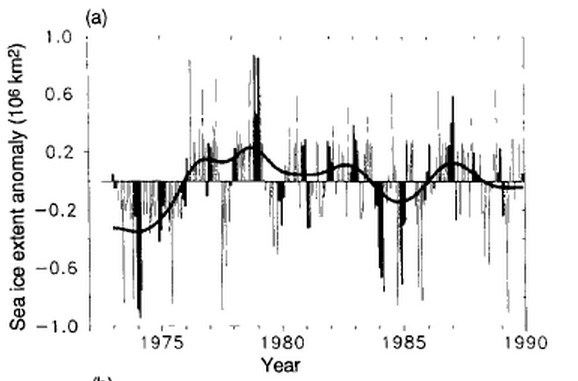
Here is what the 1990 IPCC report says on page 224 in its discussion of Figure 7.20:
"Since about 1976 the areal extent of sea-ice in the Northern Hemisphere has varied about a constant climatological level but in 1972-1975 sea-ice extent was significantly less."
http://www.ipcc.ch/ipccreports/far/wg_I/...
The report continues:
>>Gloersen and Campbell (1988) have analysed the Scanning Multi-channel (dual polarization) Microwave Radiometer data from the Nimbus 7 satellite from 1978 1987 They find little change in total global ice area but a significant decrease ol open water within the ice Their time series is short, and it is uncertain whether the decrease is real Sea-ice thickness is an important parameter <<
>>, and none of the ice extent has been unusual compared with 1975, <<
You really have no idea how stupid and unscientific that statement is, huh?
=======
Ian --
>>I don't like seeing two different ways of measuring something on the same graph a la "hide the decline" Mann. <<
Neither did Mann - so he removed the tree-ring data and showed only the measured temperature.
Do any of you know anything about anything that you have an opinion on?
You're seriously trying to make a point using a graph that stopped 25 years ago?
Will you ever learn that your sources are garbage?
I see your graph stops in 1990. Lets see what has happened since then.
http://arctic.atmos.uiuc.edu/cryosphere/...
Seems like almost every year since 2005 has had extents past the bottom of your graph.
Edit: Here are more links you may find interesting.
History of sea ice in the Arctic (Polyak et al 2010) - http://www.geo.umass.edu/faculty/jbg/Pub...
An analysis of Arctic sea ice fluctuation, 1953-77 (Walsh et al 1979) - http://journals.ametsoc.org/doi/pdf/10.1...
i don't know but i really want to know the answer any one help me.
Started in 1979 which was a cold year with lots of ice, and none of the ice extent has been unusual compared with 1975, here is a graph that was included in the IPCC AR1. http://kaltesonne.de/wp-content/uploads/2013/07/screenhunter_170-jun-15-11-10-1.jpg
Until today I did not know that.