Ignoring kano's denier fantasy answer,
The arctic is warming faster than the rest of the world, with regional averages between 2-5c warmer compared to the global average rise of ~1c.
This is manifesting in a rapid decline in the Arctic sea ice, scientists originally estimated it would be ice free (in Summer) by the end of the century, that has now had to be revised to as soon as 2030.
As well as sea ice, permafrost has also started to melt and scientists also did not expect that to be an issue for decades, but it is starting to happen now, with houses sinking in Siberia and thousands of new lakes forming across the region.
http://www.newscientist.com/article/dn22...
Some deniers like kano even still try to claim the Arctic is not shrinking, when there is simple hard evidence that it is.
http://igloo.atmos.uiuc.edu/cgi-bin/test...
Deniers will, as they have no real evidence to back any of their absurd claims still continue to peddle an endless array of conspiracy theories as they have no real science to use.
kano quotes (without link) stats he makes claims about, this is an old denier sham, he links to nothing because he has nothing, if he did post the claimed links they would have nothing to do with science but the usual range of denier blogs.
the main point on stats is the temperature data, look past denier BS on the subject and the reality is they have made not the slightest dent in the scientific validity of this data.
NASA have data from a range of agencies
http://climate.nasa.gov/key_indicators
others around the world have pretty much the same findings, this is a bit of a sensitive spot for deniers, suggest for a second that they don't have any real scientific backing for their claims and you will get lots of words thrown back making all sorts of claims, but as always there will be no substance as there is not one scientific group in the world that supports denier rot. To try and cover this denier are now engaged in a set of conspiracies to attack scientists and peer review, the later because deniers have also been able to get very little published, instead of facing the fact they can't get things published because they have flawed science, they are trying to create yet another conspiracy theory claiming peer view is also part of some 'plot', I'm sorry but that sort of nonsense is a text book symptom of the condition of 'denial'
As for your actual question the Arctic is currently running near the near a record low, the new record low was only set last year (2012) and replaced the old record low, set back in 2007.
http://nsidc.org/data/seaice_index/image...
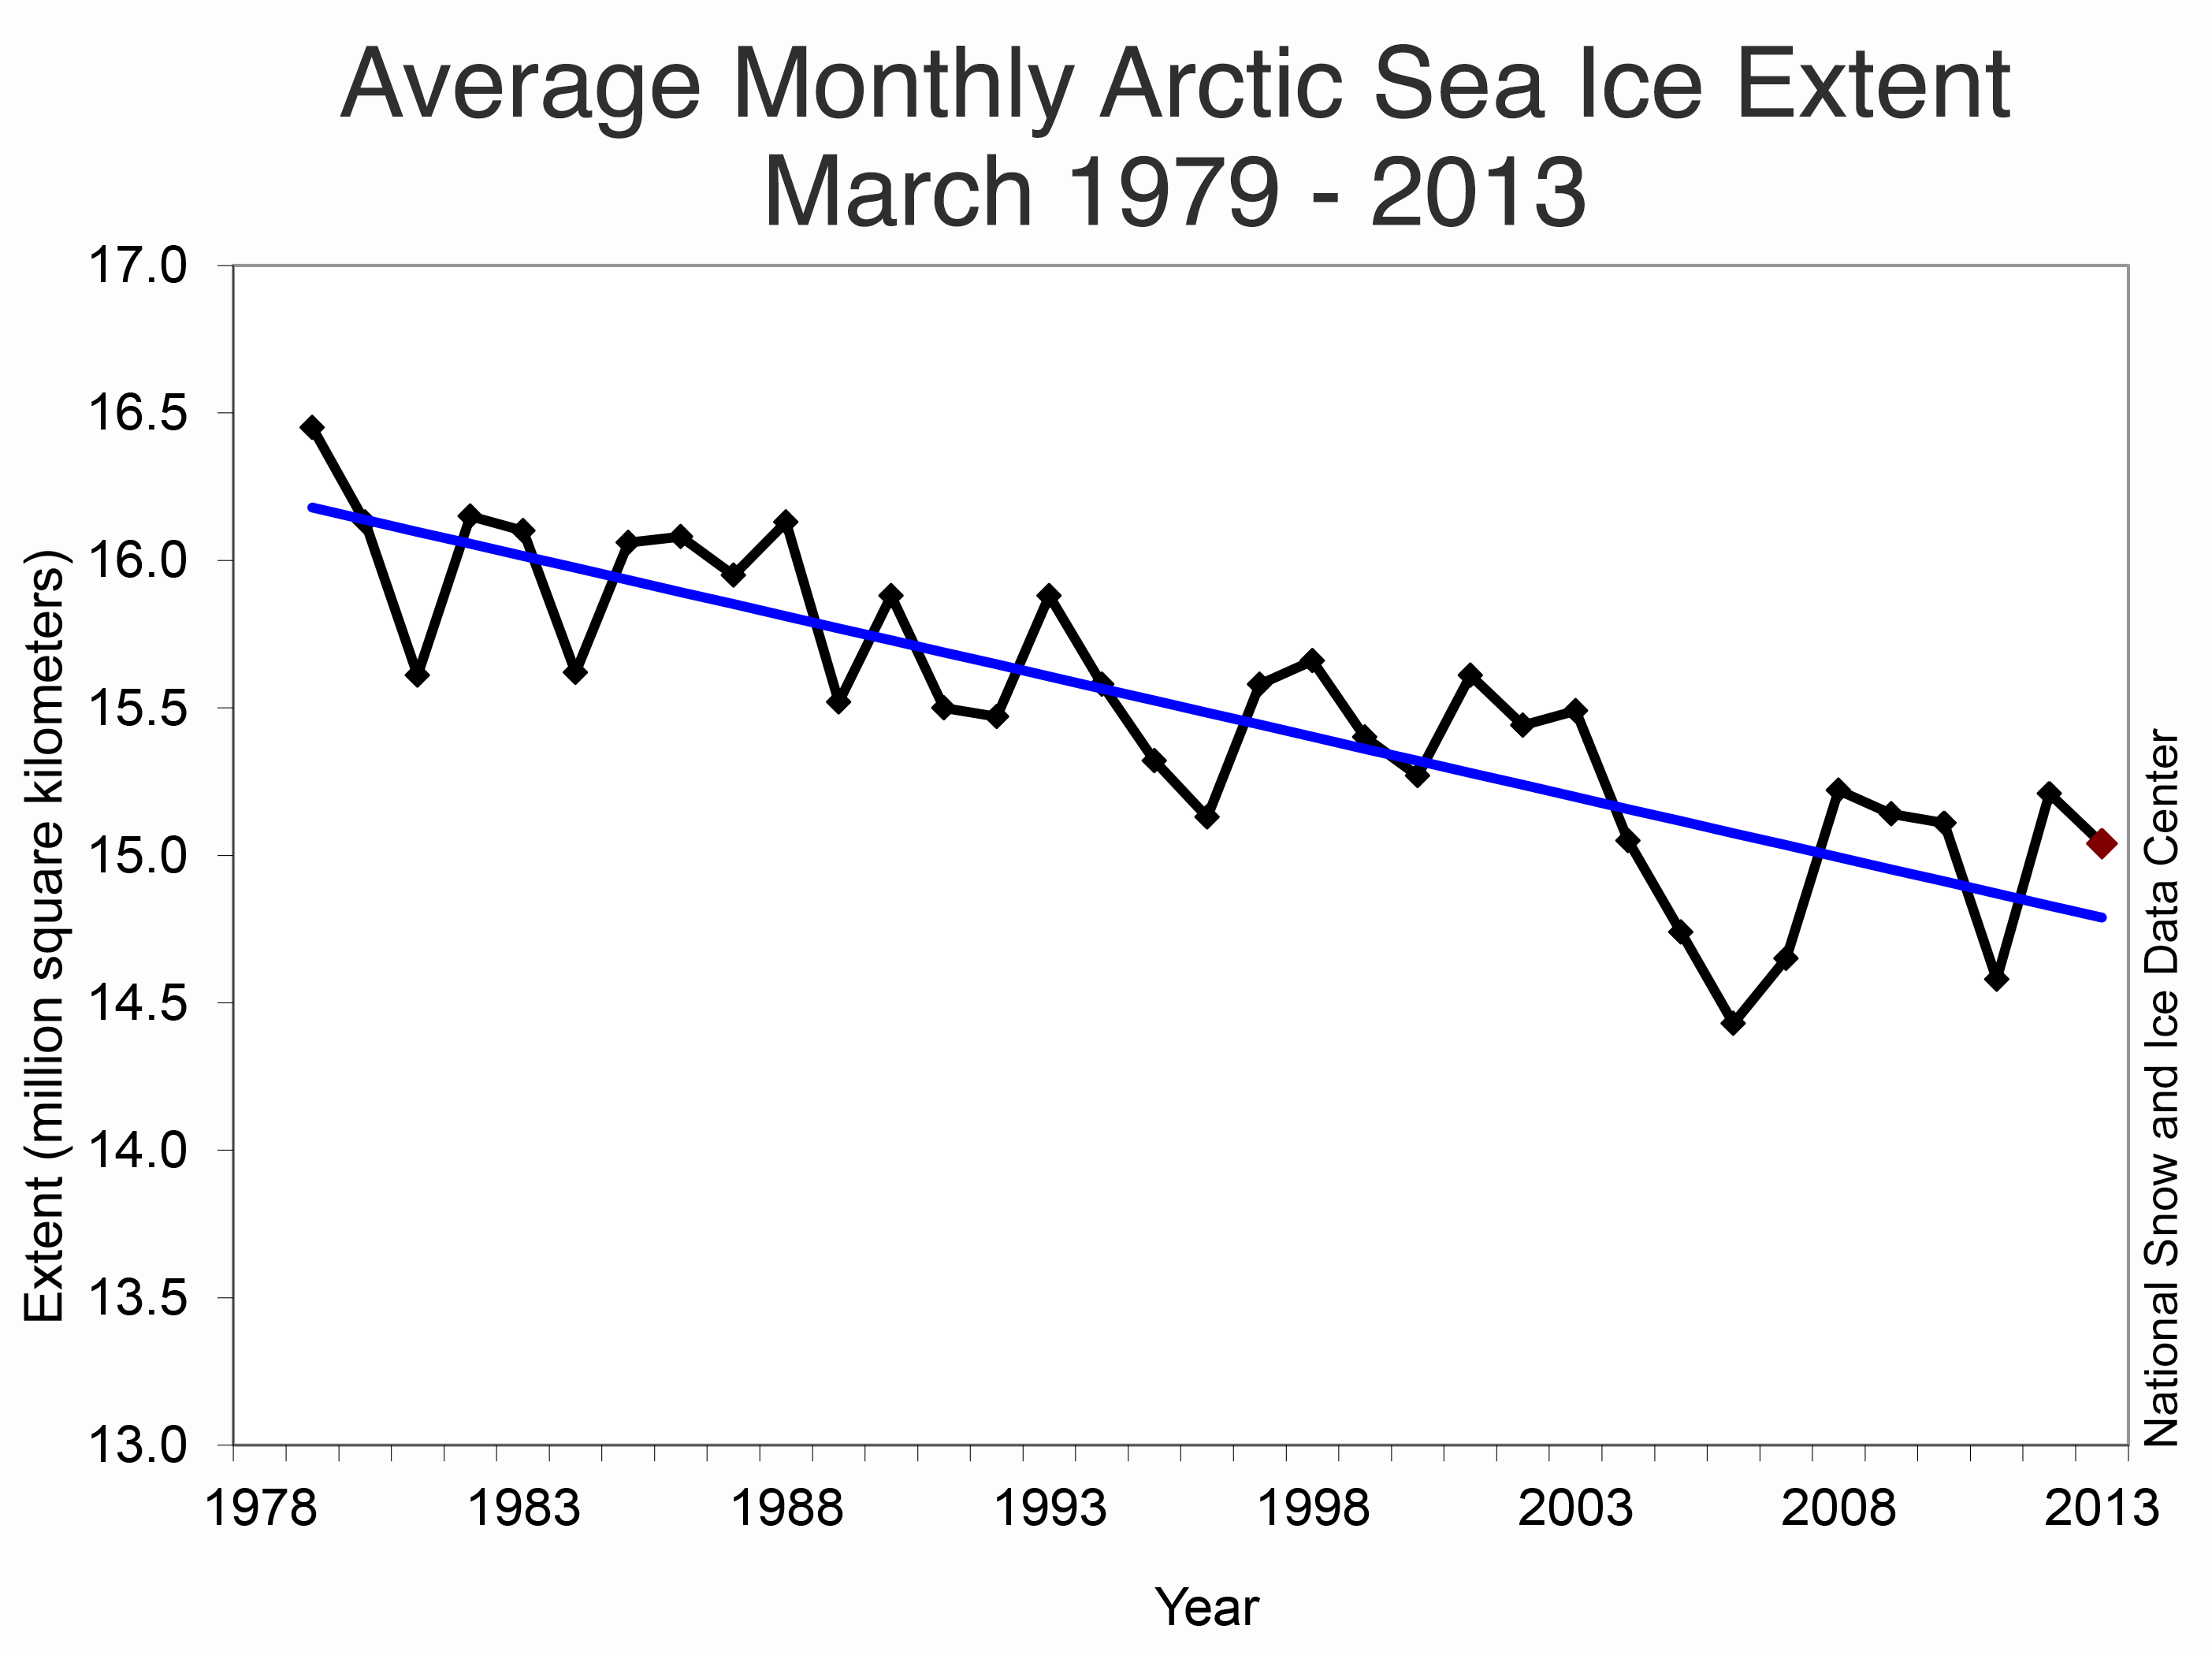
In the longer term it is doing this
http://nsidc.org/arcticseaicenews/files/...
You could ask kano to post the stats he makes claims about, that show something different, but he won't because beyond the hot air, he has nothing and I think even he knows that.
STATISTICS on the effects of global warming in the arctic poles. Because dedicated to Developing Solutions & Strategies for Climate Change.
A few likely links:
http://www.nrdc.org/globalwarming/qthini...
http://globalwarming.markey.house.gov/im...
http://www.c2es.org/science-impacts/basi...
http://en.wikipedia.org/wiki/Climate_cha...
Fish around, you should find some statistics there.
Good luck.
At temperatures above 0 degrees C, ice melts.
Check this site and see if you find anything useful. It at least has arctic sea ice.
http://climate.nasa.gov/key_indicators#s...
Well that's difficult, 1 because there is no global warming only natural climate change, 2 there are thousands of Stat's out there, some are lies some are misleading some are out of date most are changing, so pick what you want to say what you want.
You need links http://arctic.atmos.uiuc.edu/cryosphere/...
and one for free http://arctic.atmos.uiuc.edu/cryosphere/...
http://ocean.dmi.dk/arctic/plots/icecove...
http://www7320.nrlssc.navy.mil/hycomARC/...
If you go to wattsupwiththat and click on reference page, you will get the largest graphs and stats on climate change of any site, including their source, useful for pro or anti alike.
What Artic?
I need some numbers and statistics on what global warming has done in the arctic poles and northern Canada, how it affects animals, glaciers, oceans, etc... Please help. Thank you